Four doors, one grounded platform

Different operator tasks need different context. AI4SRE separates general assistance from evidence-backed SRE workflows — so the model sees what you intend, not a random mix of prompts.

AI Ops

Alert-driven recommendations

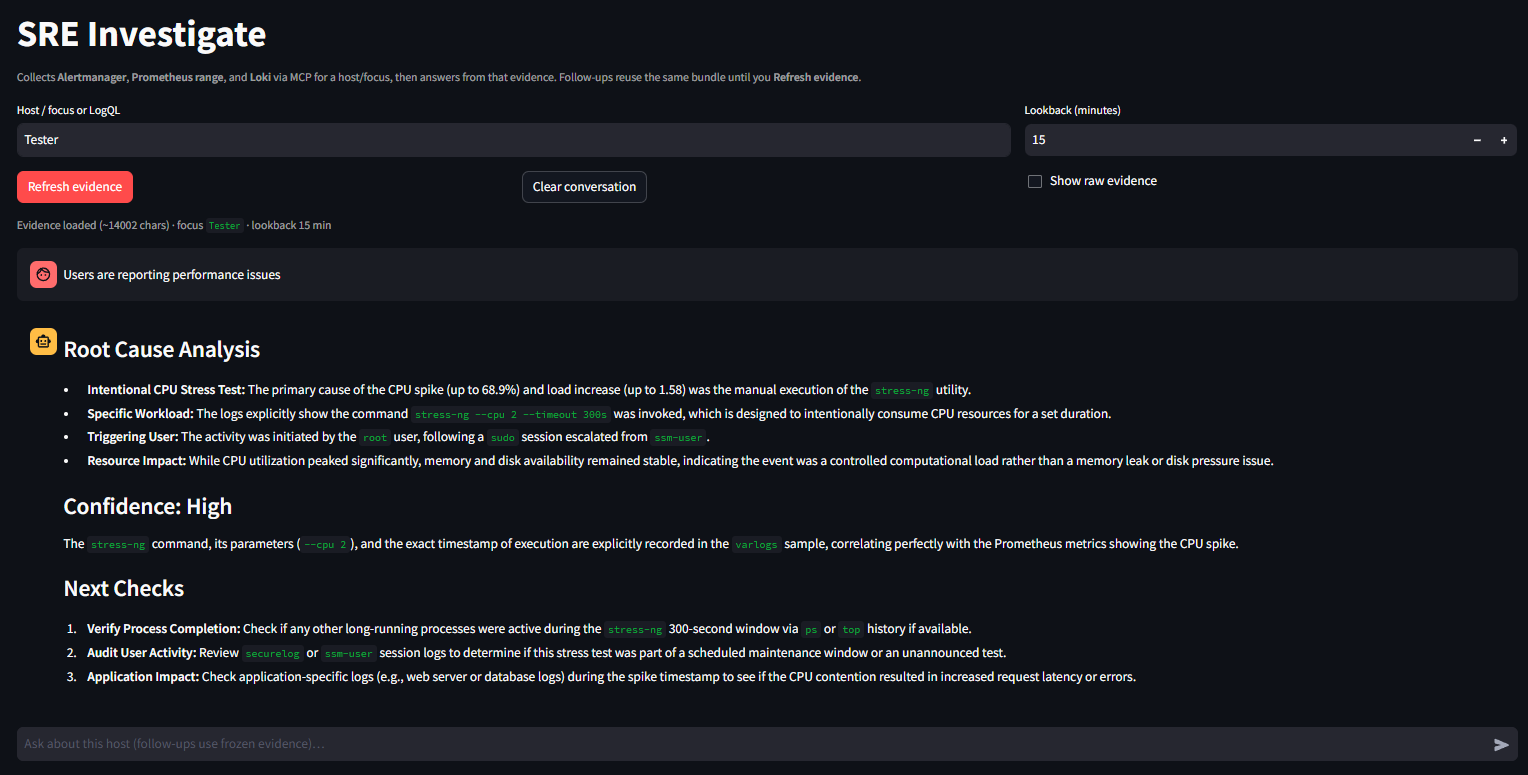
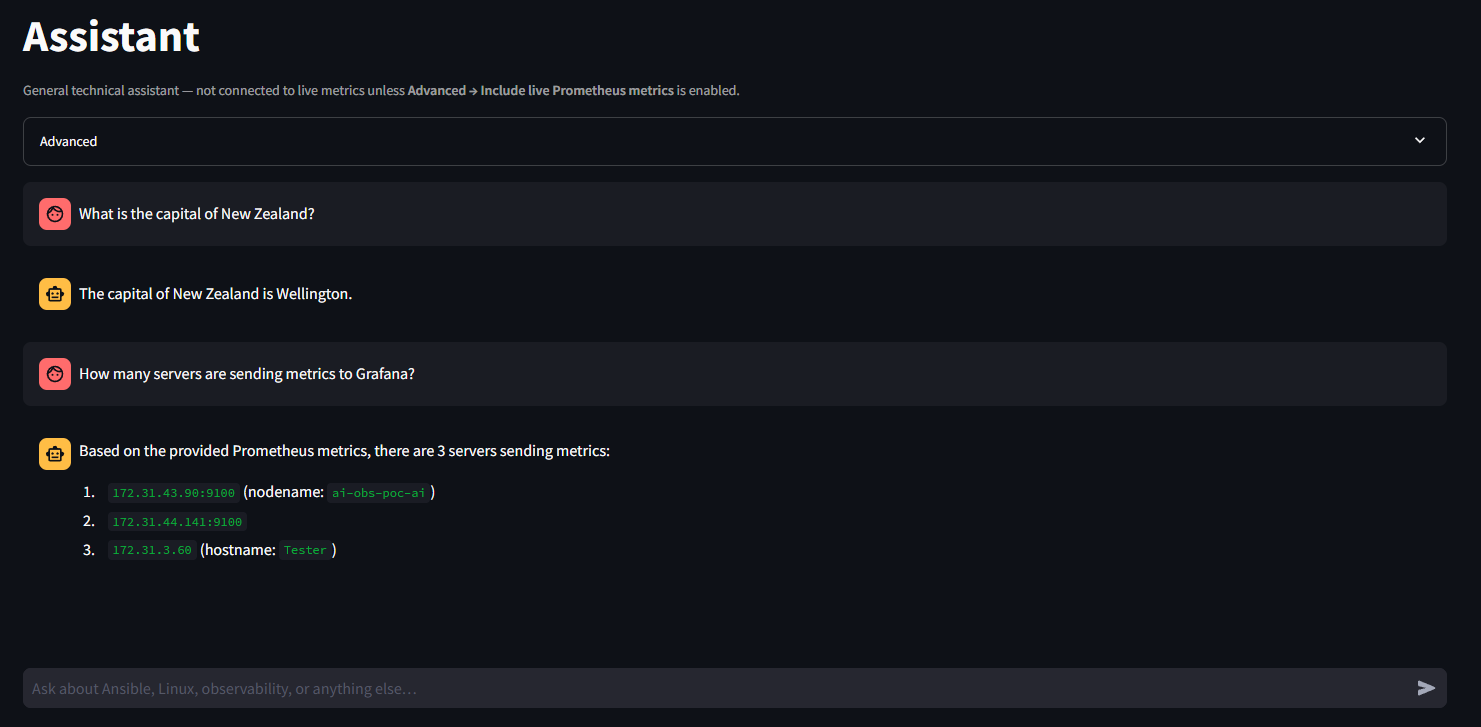
When Grafana unified alerting fires, a webhook receiver enriches the payload with optional Prometheus and Loki context, calls a private Ollama model, and returns a structured recommendation for operators.

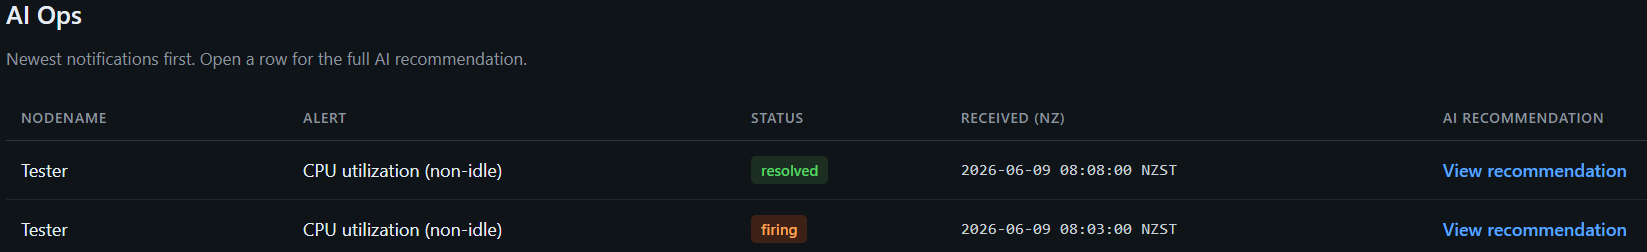
  • Dashboard of recent notifications — status, severity, link to full AI text
  • Async processing so Grafana webhooks do not time out on long inference
  • Stored history for audit and post-incident review
AI Ops recommendations dashboard — alert notifications and links to AI summaries
AI Ops — recommendations dashboard (click to enlarge)
Investigate

SRE investigation with frozen evidence

Enter a host, IP fragment, or LogQL query. The platform collects Alertmanager alerts, Prometheus range metrics (CPU, load, memory, disk), and Loki log samples via an MCP bridge — then answers from that bundle only.

  • Evidence-at-a-glance summary before the model reads raw JSON
  • Follow-up chat reuses the same evidence until you refresh
  • Designed for “why is this host slow?” not generic Q&A
SRE Investigate — evidence bundle and grounded analysis chat
Investigate — evidence bundle + grounded analysis (click to enlarge)
History

Configuration change intelligence

Scheduled collection of Linux configuration state (packages, users, services, ports, cron, sysctl, and more) is ingested into SQLite with diffs between snapshot dates. Operators query changes in natural language.

  • “When was this user added?” · “What changed before the incident?”
  • Compact evidence ranking so the model keeps security-relevant diffs
  • Complements metrics/logs with intent — what actually changed on the box
History door — configuration change table and natural-language queries
History — change table and config-aware chat (click to enlarge)
Assistant

General technical assistant

Runbooks, Ansible, architecture questions, drafting — without implying live cluster state unless you explicitly attach Prometheus metrics in Advanced mode.

  • Clear separation from incident workflows
  • Optional scoped or broad metrics attachment for capacity questions
  • Same Ollama endpoint, different prompts and guardrails
Assistant — general technical chat with optional live metrics
Assistant — general chat with optional metrics (click to enlarge)

Grounded AI — a design principle

Each door declares what evidence is in scope. Investigate and History send compact, ranked context; the model is instructed not to invent metrics, log lines, or config changes. When evidence is incomplete, the output says so and suggests the next query — not a fabricated root cause.

What the model sees

Curated JSON and text from your observability APIs and config store — bounded by context limits and explicit caps.

What it does not do

Replace Prometheus, Loki, or Grafana. It accelerates interpretation; your TSDB remains the system of record.